European Windows 2019 Hosting BLOG

BLOG about Windows 2019 Hosting and SQL 2019 Hosting - Dedicated to European Windows Hosting Customer

SQL Server 2019 Hosting - HostForLIFE.eu :: Database Connection String MS-SQL Server - Easy Steps

clock August 28, 2020 07:42 by author Peter

This is the easiest way to create a connection string to the database without taking too much time. So, many times at the beginner level, I faced problems on the connection string and providers associated with the connection string. Then, I found a way to handle it simply following the below steps. I think it should be shared with you all.
 
Hope you like this simple tutorial!
 
Let's begin with the steps:
 
Step 1
Open Notepad on your PC.
 
Step 2
Now Save the Notepad File with Ctrl+Shift+S as Connection.udl on the desktop.
 
Step 3
Now go to the Desktop and double click on the file Connection.udl. The opened file looks like:

Step 4
Now select or Enter server Name
 
Step 5
Now Select Database Name
 
Step 6
Now Press Test Connection.
 
Step 7
Click OK on Test Connection PopUp and Click OK on the Connection.udl File.
 
Step 8

Then open the Connection.udl file with Notepad, then you get the Database Connection String.

Note
This Connection.udl file only create when it is not on your system by following Step1 to Step2.
Otherwise, you can continue with From Step 3 to Step 8. Those who are unable to create a Connection.udl file, please find the attachment, and continue with Step 3 to Step 8.

HostForLIFE.eu SQL Server 2019 Hosting
HostForLIFE.eu is European Windows Hosting Provider which focuses on Windows Platform only. We deliver on-demand hosting solutions including Shared hosting, Reseller Hosting, Cloud Hosting, Dedicated Servers, and IT as a Service for companies of all sizes.


SQL Server 2019 Hosting - HostForLIFE.eu :: Using LAST_QUERY_PLAN_STATS In SQL Server

clock August 14, 2020 11:00 by author Peter

In my opinion, SQL Server 2019 is one of the greatest releases of the product that Microsoft has ever produced. The amount of improvements across the platform really allows data professionals to have better and faster queries while simultaneously minimizing effort. One of the many things that it fixes is the ability to get an actual plan without having to re-run the query.

Currently, if you are not on SQL Server 2019 and wanted to see an execution plan, you would attempt to dive into the execution plan cache to retrieve an estimated plan. Keep in mind that this just an estimated plan and the actual plan, while the shape should be the same, will have runtime metrics. These actual runtime metrics could be, different than what is shown in the estimated plan, so it is important to get the actual whenever possible.
 
With the introduction of lightweight statistics, SQL Server can retain the metrics of the actual execution plan if enabled. Note that this could introduce a slight increase in overhead, however, I haven’t yet seen it be determinantal. These metrics are vastly important when performing query tuning.
 
Metrics
    Actual number of rows per operator
    Total CPU time
    Total execution time
    Actual maximum degree of parallelism
    Memory granted and subsequently used

Two new items are also introduced for this particular feature, one being a new database scoped configuration, LAST_QUERY_PLAN_STATS, and the other a new dynamic management function, sys.dm_exec_query_plan_stats.
 
LAST_QUERY_PLAN_STATS
Introduced in SQL Server 2016, database scoped configurations allow you to have more granular control of how the database is going to behave.
 
LAST_QUERY_PLAN_STATS can either be set globally with trace flag 2451 or on each individual database. It does require compatibility level of 150 so you must be on SQL Server 2019 to take advantage of this new ability. You can enable this database scoped configuration with this command.
    ALTER DATABASE SCOPED CONFIGURATION SET LAST_QUERY_PLAN_STATS = ON 

Like with anything else, there is a minor overhead with enabling this. SQL Server does have to work just a tad bit harder to capture and store the runtime metrics for the plans. This overhead should be minimal but as always, proper testing should be completed against your given workloads.
 
SYS.DM_EXEC_QUERY_PLAN_STATS
Along with the new database scoped configuration comes a new dynamic management function, or DMF. This DMF requires the plan_handle, which is obtains by cross applying it with one of the other dmvs, such as,
    dm_exec_cached_plans
    dm_exec_query_stats
    dm_exec_requests
    dm_exec_procedure_stats
    dm_exec_trigger_stats


Here is an example query,

    SELECT * FROM SYS.DM_EXEC_CACHED_PLANS CP 
    CROSS APPLY SYS.DM_EXEC_QUERY_PLAN_STATS(CP.PLAN_HANDLE)  PS 
    WHERE PS.DBID = 10 


Let’s take a look at this feature in action.
 
Finding the Last Known Actual Plan
 Using WideWorldImporters, let’s first ensure that the database is at compatibility level of 150 and the new database scoped configuration is also enabled.

 
We can see that it is now at the correct compatibility level and the database scoped configuration is also been enabled. Now we can run a query and go find the actual plan utilizing the new DMF.
 
I am going to do a simple join between the Sales.Orders and Sales.OrderLines tables. After the results are returned, I’ll interrogate the new DMF using sys.dm_exec_cached_plans as a way to get the plan handle
    select * from sales.orders o 
           inner join sales.OrderLines ol on o.OrderID=ol.OrderID; 
    select size_in_bytes,cacheobjtype,objtype,plan_handle,ps.dbid, ps.query_plan 
    from sys.dm_exec_cached_plans cp 
           cross apply sys.dm_exec_query_plan_stats(cp.plan_handle) ps 
    where ps.dbid = 10 


Using LAST_QUERY_PLAN_STATS in SQL Server
 
The resulting query_plan column is being derived from the new DMF. If you click on the hyperlink in SQL Server Management Studio, it will open the query plan. Once opened, hit F4 or right click to show the properties of the plan and select the Clustered Index Scan of the Sales.OrderLines table.

You can now see the actual runtime statistics that SQL Server captured when the query was executed.
 
As I mentioned at the beginning of this post, SQL Server 2019 is one of the best releases of the product that Microsoft has ever accomplished. Features such as lightweight query profiling and LAST_QUERY_PLAN_STATS just continue to make the data professionals life that much easier.
 
Have you migrated to SQL Server 2019 yet? Are you using this feature? If you are, drop me a note! I’d love to hear about your experience with it!


Windows Server 2016 SSD Hosting - HostForLIFE.eu :: Streaming Logs Using Windows PowerShell

clock August 7, 2020 13:51 by author Peter

Log data helps technical personnel quickly drill down on application related issues including:


  • Pinpointing areas of poor performance
  • Assessing application health and troubleshooting
  • Diagnosing and identifying the root cause of application installation and run-time errors

There are a lot of tools available in the market which help you stream logs. But with most of them, I have personally experienced if they are easy to use they are paid and most of open source is too complex to configure. In this blog, I will explain how you can implement a simple log streaming tool using Powershell. This is more of a dev/debug helper tool, although if you invest time in the building then you can take it to a product level tool.
To start with,  below is a simple one-line Powershell which will read log file data in real time. The best part is it will WAIT for any more logs to be written on file and will stream it as soon as it completes on the file.

Get-Content "****LOG FILE PATH***" -WAIT

To take it to the next level let's manipulate the logs written before they are presented on screen. In the below code sample if you provide a log with the message containing "*" then the script will change all "*" to "@" before presenting.

Sample log message: INFO InfoLog - ***************CONFIG READ***************
$file = "*******LOG FILE PATH********"  
Get - Content $file - Wait | ForEach - Object - Begin {  
    $counter = 1  
    $lines = @(Get - Content $file).Count  
} - Process {  
    if ($counter++ - gt $lines) {  
        Write - host $_.ToString().Replace("*", "@")  
    }  
}  


Let's take it a bit further. Suppose we need to present Error type messages to be highlighted with RED. And the rest of the message must be in GREEN.
Sample log message: INFO InfoLog - ***************CONFIG READ****************
Sample log message: ERROR ErrorLog - ************CONFIG READ****************

$file = "*******LOG FILE PATH********"  
Get - Content $file - Wait | ForEach - Object - Begin {  
    $counter = 1  
    $lines = @(Get - Content $file).Count  
} - Process {  
    if ($counter++ - gt $lines) {  
        if ($_.ToString().Contains("ERROR")) {  
            Write - host $_.ToString() - foregroundcolor "red"  
        } else {  
            Write - host $_.ToString() - foregroundcolor "green"  
        }  
    }  
}  


There are endless possibilities and use cases which can be implemented, the sky is the limit.


SQL Server 2019 Hosting - HostForLIFE.eu :: New Resumable Online Index Create SQL Server 2019

clock August 5, 2020 13:32 by author Peter

SQL Server 2019 brings a very exciting new feature that was long overdue. Resumable Online Index Creation is one of my favorite new things. This, when paired with Resumable Index Rebuilds introduced with SQL Server 2017, really gives database administrators much more control over the index processes.

Have you ever started to build a new index on very large table only to have users call and complain their process is hung, not completing, or sthe ystem is slow? That’s when you realize you’re the cause because you tried to sneak in a new index. I have many times; because creating a new index can impact the performance and can be a problematic process for users when you have no or little downtime windows available. When you kill the create process, it rolls back requiring you to start from the beginning the next time. With resumable Online Index Creation, now you have the ability to pause and restart the build at the point it was paused. You can see where this can be very handy.

To use this option for creating the index, you must include "RESUMABLE=ON".

CREATE INDEX MyResumableIndex on MyTable (MyColumn) WITH (ONLINE=ON, RESUMABLE=ON, MAX_DURATION=30)  

Let’s say you have only two 30-minute windows available to create this new index over the next two days. You could use the MAX_DURATION option with the new RESUMABLE=ON to specify the time interval for an index being built. Once the 30 minutes time is up, the index building automatically gets paused if it has not completed. When you’re ready the next day, you can RESUME right where it left off, allowing you to complete the process. Very cool.

Another added benefit is managing transaction log growth. As we all know, creating indexes, especially large ones, can cause hefty log growth events and can unfortunately lead to running out of disk space. This new functionality allows us to better manage that. We can now pause the process and truncate or backup the log mid process building the index in chunks.

In the case of when you create an index only to get complaints from users or manage your log growth, you can simply do the below to PAUSE and restart it when a time is better, or your transaction log maintenance has completed.

You can KILL the SPID creating the index or run the below.
ALTER INDEX MyResumableIndex ON MyTable PAUSE; 

To restart -

ALTER INDEX MyResumableIndex on MyTable RESUME; Or simply re-execute your CREATE INDEX statement  

According to MSDN, Resumable online index create supports the follow scenarios:

  • Resume an index creation operation after an index create failure, such as after a database failover or after running out of disk space.
  • Pause an ongoing index creation operation and resume it later allowing to temporarily free system resources as required and resume this operation later.
  • Create large indexes without using as much log space and a long-running transaction that blocks other maintenance activities and allows log truncation.

Note
SORT_IN_TEMPDB=ON is not supported when using RESUMABLE=ON

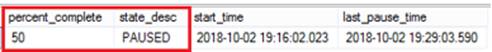
Once you pause it, how do you know how far the index got and how much is left to be created? With the Resumable REBUILD Index feature added in SQL Server 2017, we have also got a new sys.index_resumable_operations system view. This view shows us the percentage complete, current state, start time, and last pause time. I am very excited about this new Index Create feature. I think this is a big WIN for SQL Server 2019.

HostForLIFE.eu SQL Server 2016 Hosting
HostForLIFE.eu is European Windows Hosting Provider which focuses on Windows Platform only. We deliver on-demand hosting solutions including Shared hosting, Reseller Hosting, Cloud Hosting, Dedicated Servers, and IT as a Service for companies of all sizes.


About HostForLIFE

HostForLIFE is European Windows Hosting Provider which focuses on Windows Platform only. We deliver on-demand hosting solutions including Shared hosting, Reseller Hosting, Cloud Hosting, Dedicated Servers, and IT as a Service for companies of all sizes.

We have offered the latest Windows 2019 Hosting, ASP.NET 5 Hosting, ASP.NET MVC 6 Hosting and SQL 2019 Hosting.


Month List

Tag cloud

Sign in